Home
Training
Dashboard
Products
Help
Blog
Sign up
Login
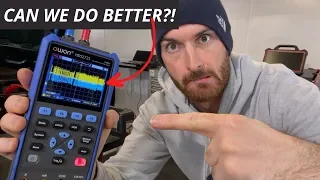
OWON HDS272S Handheld Oscilloscope for Automotive Diagnostics
1. OWON HDS272S for Automotive Diagnostics
1. Unlocking Precision - Digital Multimeter
2. Waveform Generator
1. Pulse Width Modulation
2. Injector Pattern
3. Camshaft/Crankshaft Signal
3. Real World Diagnostics on the Vehicle!
1. Crankshaft Signal
2. Injector Signal
3. CAN Bus Signal
OWON HDS272S Handheld Oscilloscope for Automotive Diagnostics
9 minute read
Related Posts
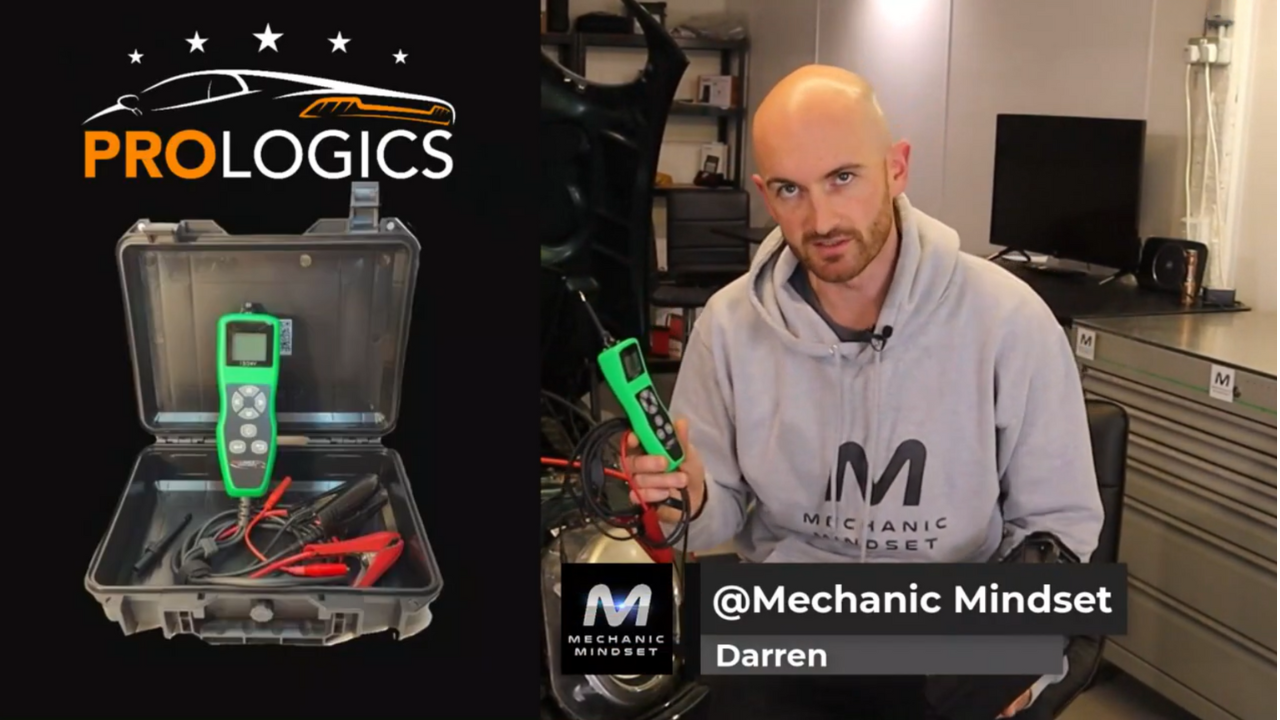
Test Your Sensor Systems with the ProLogics Probe - Here's How!
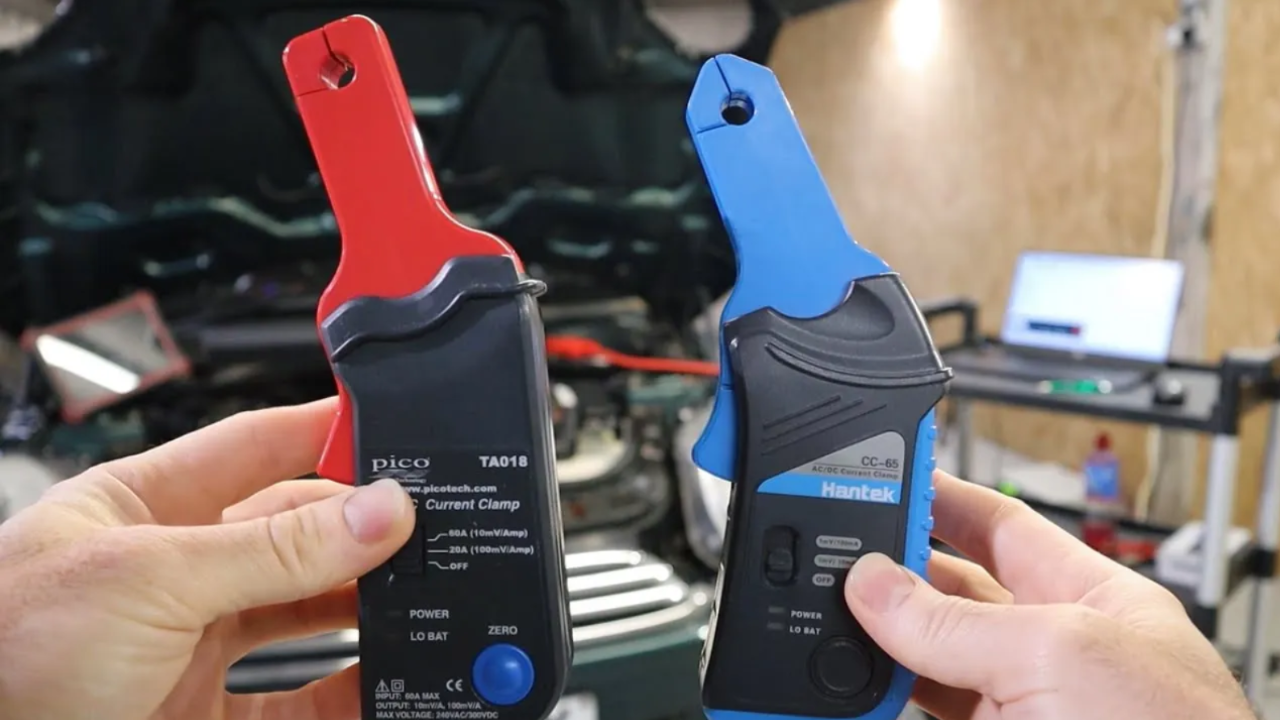
Which One Is Best? Hantek CC-65 vs PicoScope TA018 Current Clamp
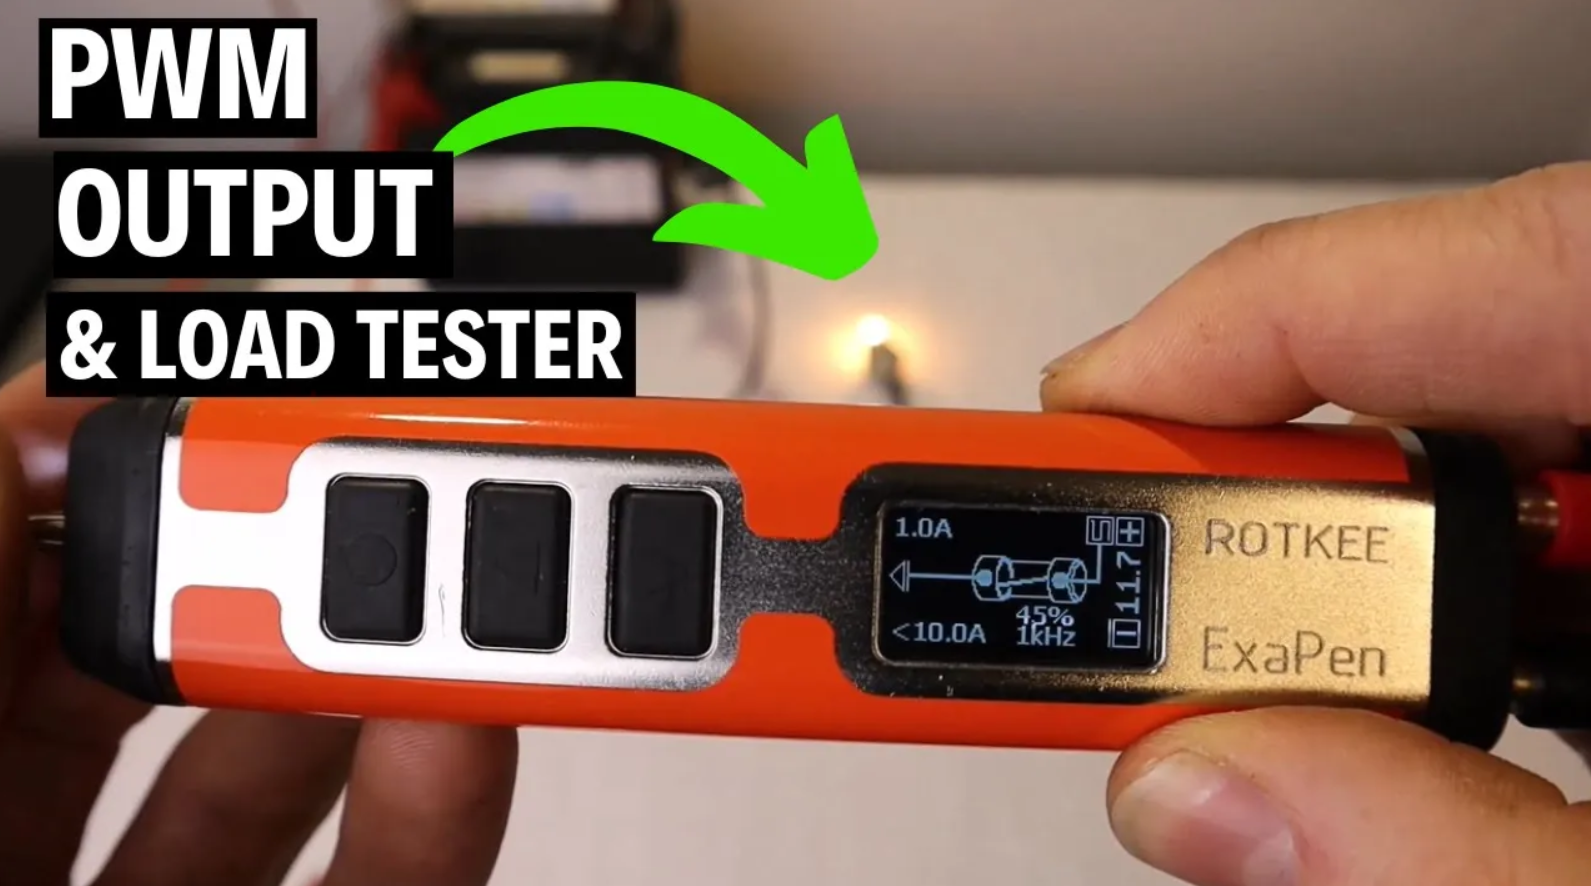
NEW Rotkee ExaPen Load Tester and PWM Powering Probe
TOPDON Battery Tester BT200
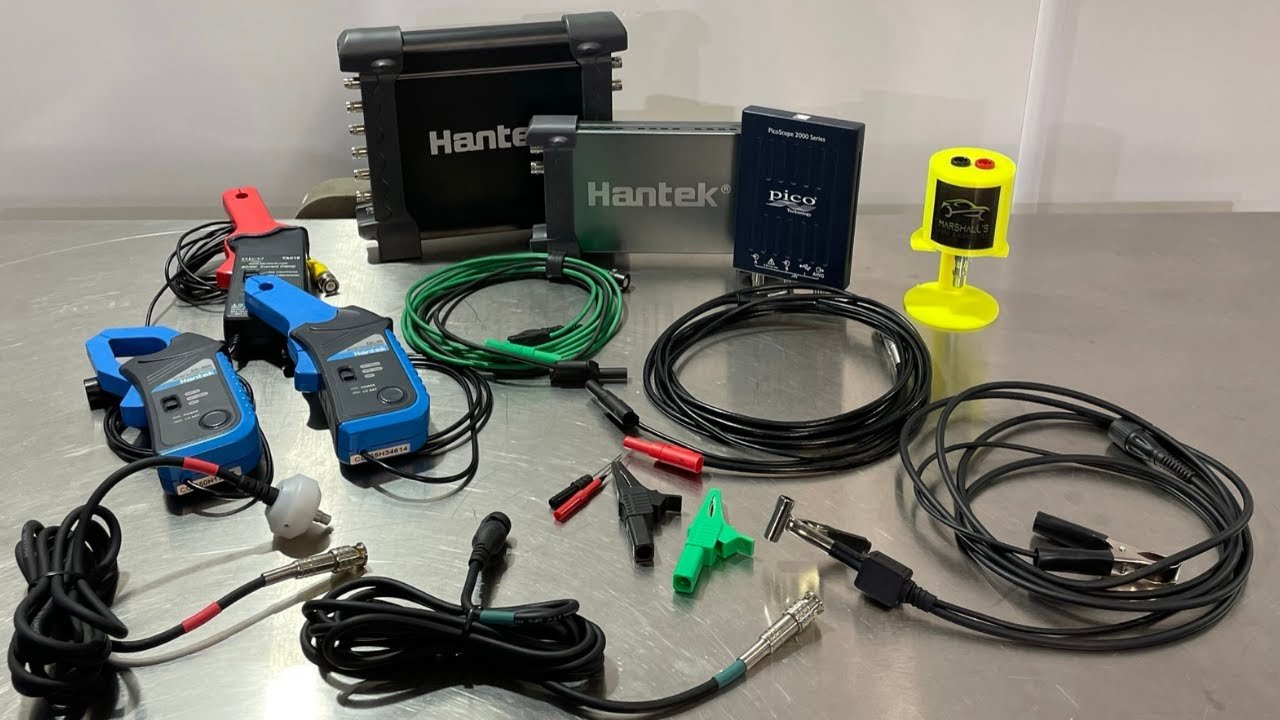
Automotive Oscilloscope Starter Kit